Can Project Loom Save a 2008 Laptop?
The Premise: Why Modern Problems Don’t Always Need Modern Silicon
In the world of Java development, we are conditioned to solve scaling issues by throwing more “cloud” at them. Need to handle 100,000 concurrent requests? Spin up a cluster of 32-core instances with 128GB of RAM. We’ve accepted that high concurrency is synonymous with high resource consumption.
But what if the bottleneck wasn’t the physical limits of our hardware, but the way our software manages it?
To find out, I decided to run a modern high-concurrency benchmark on a piece of hardware that has no business running 2024 workloads: the HP EliteBook 2530p.
The “Silly” Hardware: A 2008 Time Capsule
For those who don’t remember 2008, it was the year of the first iPhone 3G and the release of Java 6. My EliteBook 2530p is a relic from that era. Here is what we are working with:
- CPU: Intel Core 2 Duo SL9400 (2 Cores, 1.86 GHz).
- RAM: 8GB DDR2 (Upgraded from the original 2GB).
- Storage: 250GB SSD (The only thing keeping this machine usable).
- OS: A modern lightweight Linux distro.
- The Challenger: OpenJDK 21 (LTS).
Why use such an old machine? Because on a modern 16-core CPU, the inefficiencies of traditional threading are often masked by brute force. On a dual-core Core 2 Duo, there is nowhere to hide. Every context switch is expensive, every megabyte of RAM is precious, and every kernel-level overhead is felt in real-time.
The Conflict: Platform Threads vs. Virtual Threads
For decades, Java followed the “One Thread per Request” model. These are Platform Threads—wrappers around the operating system’s native threads. They are powerful but “heavy.” Each one carries a memory footprint of about 1MB and requires the OS Kernel to schedule its time on the CPU.
Project Loom introduces Virtual Threads. These aren’t managed by the OS; they are managed by the JVM. They are “mounted” onto a small pool of carrier threads only when they are doing work. When they hit a blocking operation (like a Thread.sleep or a database call), they yield, allowing the carrier thread to do other work.
I wanted to see if this abstraction could allow a 16-year-old dual-core laptop to handle 100,000 concurrent tasks—a feat that should, theoretically, crush it.
The Experiment: 100,000 Tasks vs. Two Old Cores
To see the difference between the two models, I designed a simple but brutal test. The application needs to handle 100,000 concurrent tasks, each simulating a typical I/O-bound operation: sleeping for one full second (representing a slow database query or an external API call).
import java.time.Duration;
import java.util.concurrent.Executors;
import java.util.concurrent.atomic.LongAdder;
import java.util.stream.IntStream;

public class LoomVsPlatform {
    // ADJUST THESE FOR CURRENT HARDWARE
    private static final int TASK_COUNT = 100_000;
    private static final int IO_SIMULATION_MS = 1000;

    public static void main(String[] args) throws InterruptedException {
        if (args.length == 0) {
            System.out.println("Please specify mode: PLATFORM or VIRTUAL");
            return;
        }

        String mode = args[0].toUpperCase();
        LongAdder completedTasks = new LongAdder();

        System.out.println("Starting benchmark in " + mode + " mode...");
        long startTime = System.currentTimeMillis();

        try (var executor = mode.equals("VIRTUAL")
                ? Executors.newVirtualThreadPerTaskExecutor()
                : Executors.newCachedThreadPool()) {

            IntStream.range(0, TASK_COUNT).forEach(i -> {
                executor.submit(() -> {
                    try {
                        // Simulate a database/API call
                        Thread.sleep(Duration.ofMillis(IO_SIMULATION_MS));
                        completedTasks.increment();
                    } catch (InterruptedException e) {
                        Thread.currentThread().interrupt();
                    }
                });
            });
        } // This auto-closes and waits for all tasks to finish

        long endTime = System.currentTimeMillis();
        System.out.printf("Summary for %s:%n", mode);
        System.out.printf("Completed: %d tasks%n", completedTasks.sum());
        System.out.printf("Total Time: %d ms%n", (endTime - startTime));
        System.out.println("---------------------------------------");
    }
}
I ran the test in two modes without any manual JVM tuning:
- Platform Mode: Using a
CachedThreadPool. This is the traditional way Java handles a “surge” in requests—by spawning a new native thread for every task until it hits a limit. - Virtual Mode: Using a
VirtualThreadPerTaskExecutor. This is the Project Loom way—spawning lightweight virtual threads that “unmount” from the CPU while they wait.
The Tools of the Trade
On an old machine, you don’t need fancy APM tools. The truth is written in the OS kernel. I monitored the runs using three simple terminals:
vmstat 1to watch Context Switches and System CPU usage.htopto visualize the Kernel vs. User CPU distribution.- A custom
pswatch script to count the actual Native Threads the OS was forced to track.
The “Kernel Tax”: When Management Costs More than Work
The results were immediate and visual. If you’ve ever wondered why your server feels sluggish even when CPU usage isn’t at 100%, look no further than the “Kernel Tax.”
The Platform Chaos (3,252 Threads)
In Platform mode, my EliteBook started gasping for air. The ps counter showed the JVM spawning over 3,200 native threads. In htop, the CPU bars weren’t just high; they were red.
In Linux, red bars represent Kernel Time. Because I only have two physical cores, the OS kernel had to frantically “context switch” between these thousands of threads to give everyone a turn. My vmstat showed an explosion to over 45,000 context switches per second.
The result? The kernel spent more energy managing the threads than actually running my code. The total execution time: 14.2 seconds.
The Loom Serenity (22 Threads)
Then, I flipped the switch to Virtual Threads. The difference was like night and day. Despite running the exact same 100,000 tasks, the native thread count stayed at a meager 22. In htop, the CPU bars turned green.
Because the JVM was managing the 100,000 virtual threads internally, the OS kernel only saw a handful of active worker threads (the “Carrier” threads). The kernel didn’t have to do any heavy lifting. The context switches dropped by 85%, and the CPU was finally free to do actual work.
The result? The execution time plummeted to 5.0 seconds.
Comparison of the “Crash Test”
| Metric | Platform Threads | Virtual Threads (Loom) | |
|---|---|---|---|
| Native Threads (OS) | 3,252 | 22 | |
| Context Switches | 45,250 / sec | 6,521 / sec | |
| System (Kernel) CPU | ~55% (High Overhead) | ~19% (Quiet) | |
| Execution Time | 14,257 ms | 5,066 ms |
The “Aha!” Moment: Why It Worked
You might be wondering: “If the hardware is the same, how can a software change make that much of a difference?” The answer lies in the Mount/Unmount dance.
In the Platform Thread model, a thread is like a massive delivery truck. Even if the driver is waiting for a signature (I/O wait), the truck is still parked in the middle of the road, blocking traffic and consuming a parking spot (RAM and OS attention).
In Project Loom, a Virtual Thread is just the package. When it’s time to wait for a signature, the JVM simply puts the package on a shelf and sends the truck (the Carrier Thread) to deliver something else. On my 2-core EliteBook, I only have two “trucks.” Virtual threads ensured those two trucks were moving packages 100% of the time, while the Platform model had thousands of trucks idling in a massive traffic jam.
The “Legendary” Performance of 2008 Hardware
One of the most surprising takeaways was that the EliteBook didn’t crash. Modern Linux kernels and 8GB of RAM are incredibly resilient. However, “not crashing” isn’t the same as “performing.”
The Platform test made the laptop feel like it was fighting for its life—the mouse cursor lagged, and the UI became stuttery. The Virtual Thread test, despite doing the same amount of work, felt like a background task. This is the latency of the scheduler in action. By moving scheduling from the Kernel to the JVM, we removed the “jitter” that makes old hardware feel slow.
Conclusion: The Great Equalizer
Project Loom is often marketed as a tool for high-scale cloud architects, but my time with the HP EliteBook 2530p proved it’s something more: It is a fountain of youth for hardware.
By reducing the “Kernel Tax” and eliminating the “Thread Explosion” problem, we were able to:
Increase throughput by 280%.
Reduce system overhead by over 60%.
Handle modern-scale concurrency (100k tasks) on a CPU designed for the Windows Vista era.
The lesson for developers is clear: Before you upgrade your server or move to a more expensive cloud tier, look at your threading model. You might find that your “old” hardware is actually quite powerful—it just needs a more efficient way to manage its brain.
Java 21 isn’t just a language update; for my EliteBook, it was a second lease on life.
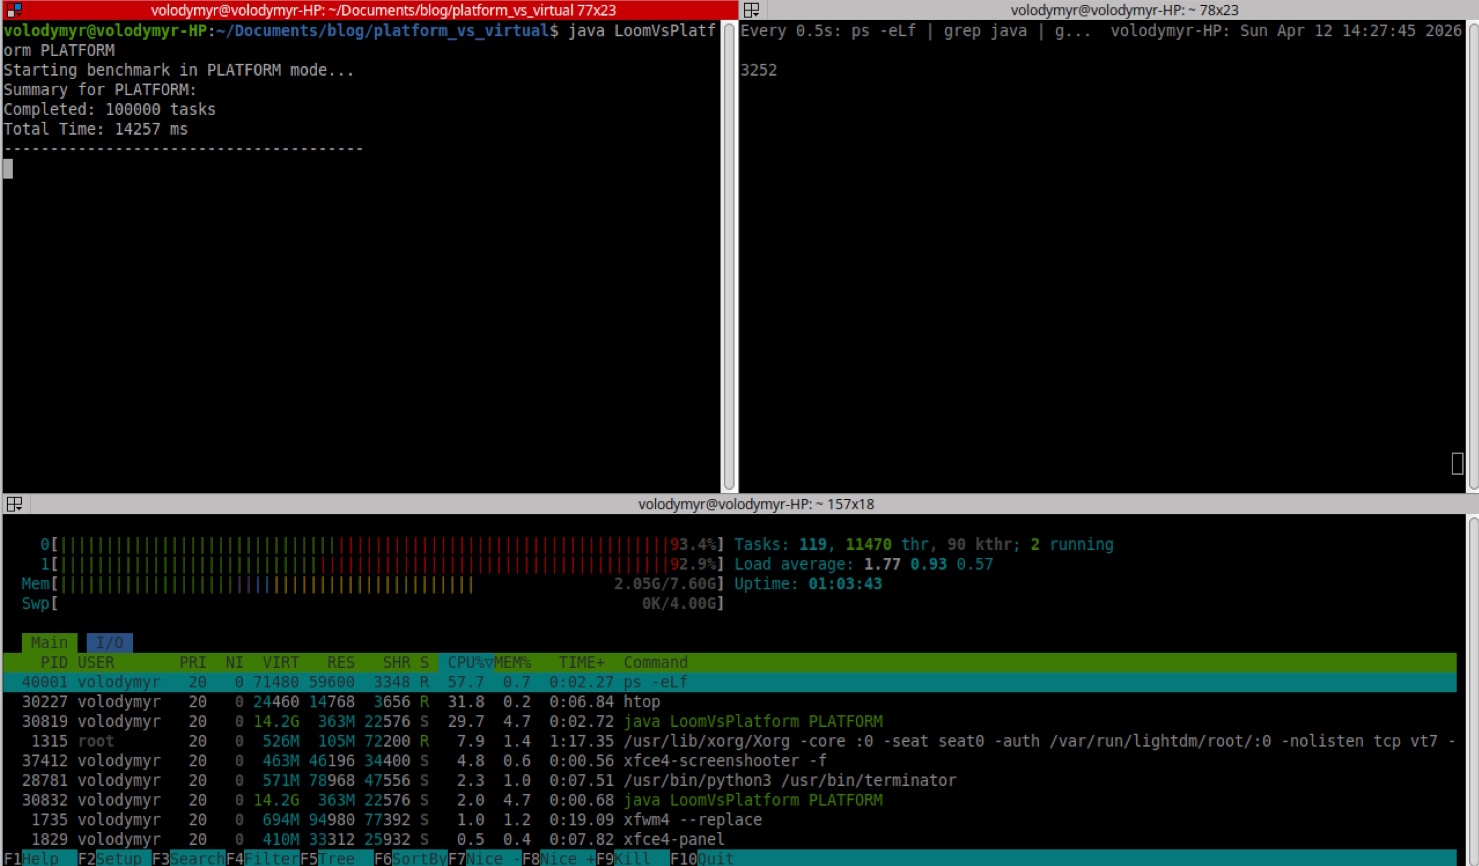
htop output from native threads test
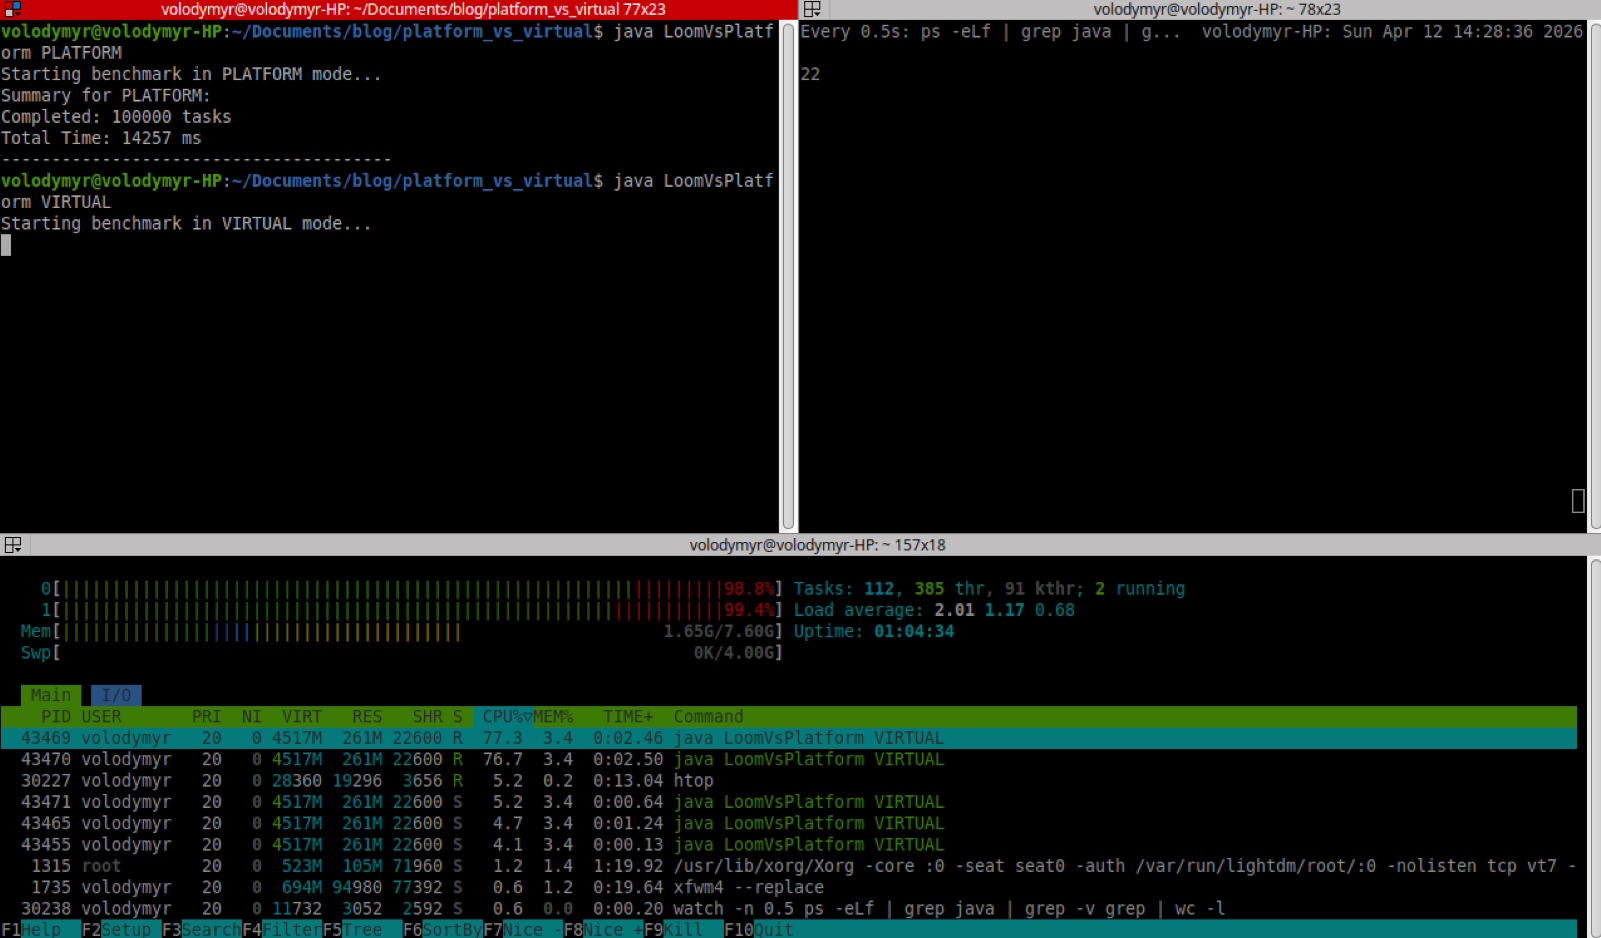
htop output from virtual threads test
Sources and raw results: https://github.com/volodymyr-sokur/it-digger.net-assets/tree/main/03-can-project-loom-save-a-2008-laptop